When one agent isn't enough
Orchestrating secure parallel agent swarms
Pamela Fox
Python Cloud Advocate · Microsoft · pamelafox.org
Agents need somewhere safe to act. This talk starts with a working research swarm, then goes underneath it:
the execution environment, the security boundaries, the code, and the telemetry.
Part 1 of 4
Introducing the swarm
One question, many parallel researchers
Introducing the swarm
Sandboxes 101
Back to the swarm
Wrapping up
First the problem and a working demo: one question fanned out to parallel researchers, each in its own sandbox.
One question, several independent research tasks
“My family of four in California is deciding whether to replace our gas car (Subaru Forester 2001) with a hybrid version of the Forester in 2026.
Compare the total five-year cost, charging practicality, winter range, reliability, insurance, and available incentives.
Include the strongest reasons not to switch, identify assumptions that could change the recommendation, and produce a decision checklist.”
Example research plan
What's the five-year cost of the hybrid vs. keeping the 2001?
Which California incentives apply?
How do winter range and reliability compare?
How much would insurance change?
Fan-out makes the answer faster and more thorough.
But now several agents need compute, permissions, and cleanup at once .
Preview the Forester question (the "Forester upgrade" sample button in the app). The sub-questions shown are an illustrative plan; the live planner
may split it differently (the sample returns 4-6 questions). The interesting part isn't the fan-out itself,
it's that each branch needs somewhere to run.
Demo: the research swarm
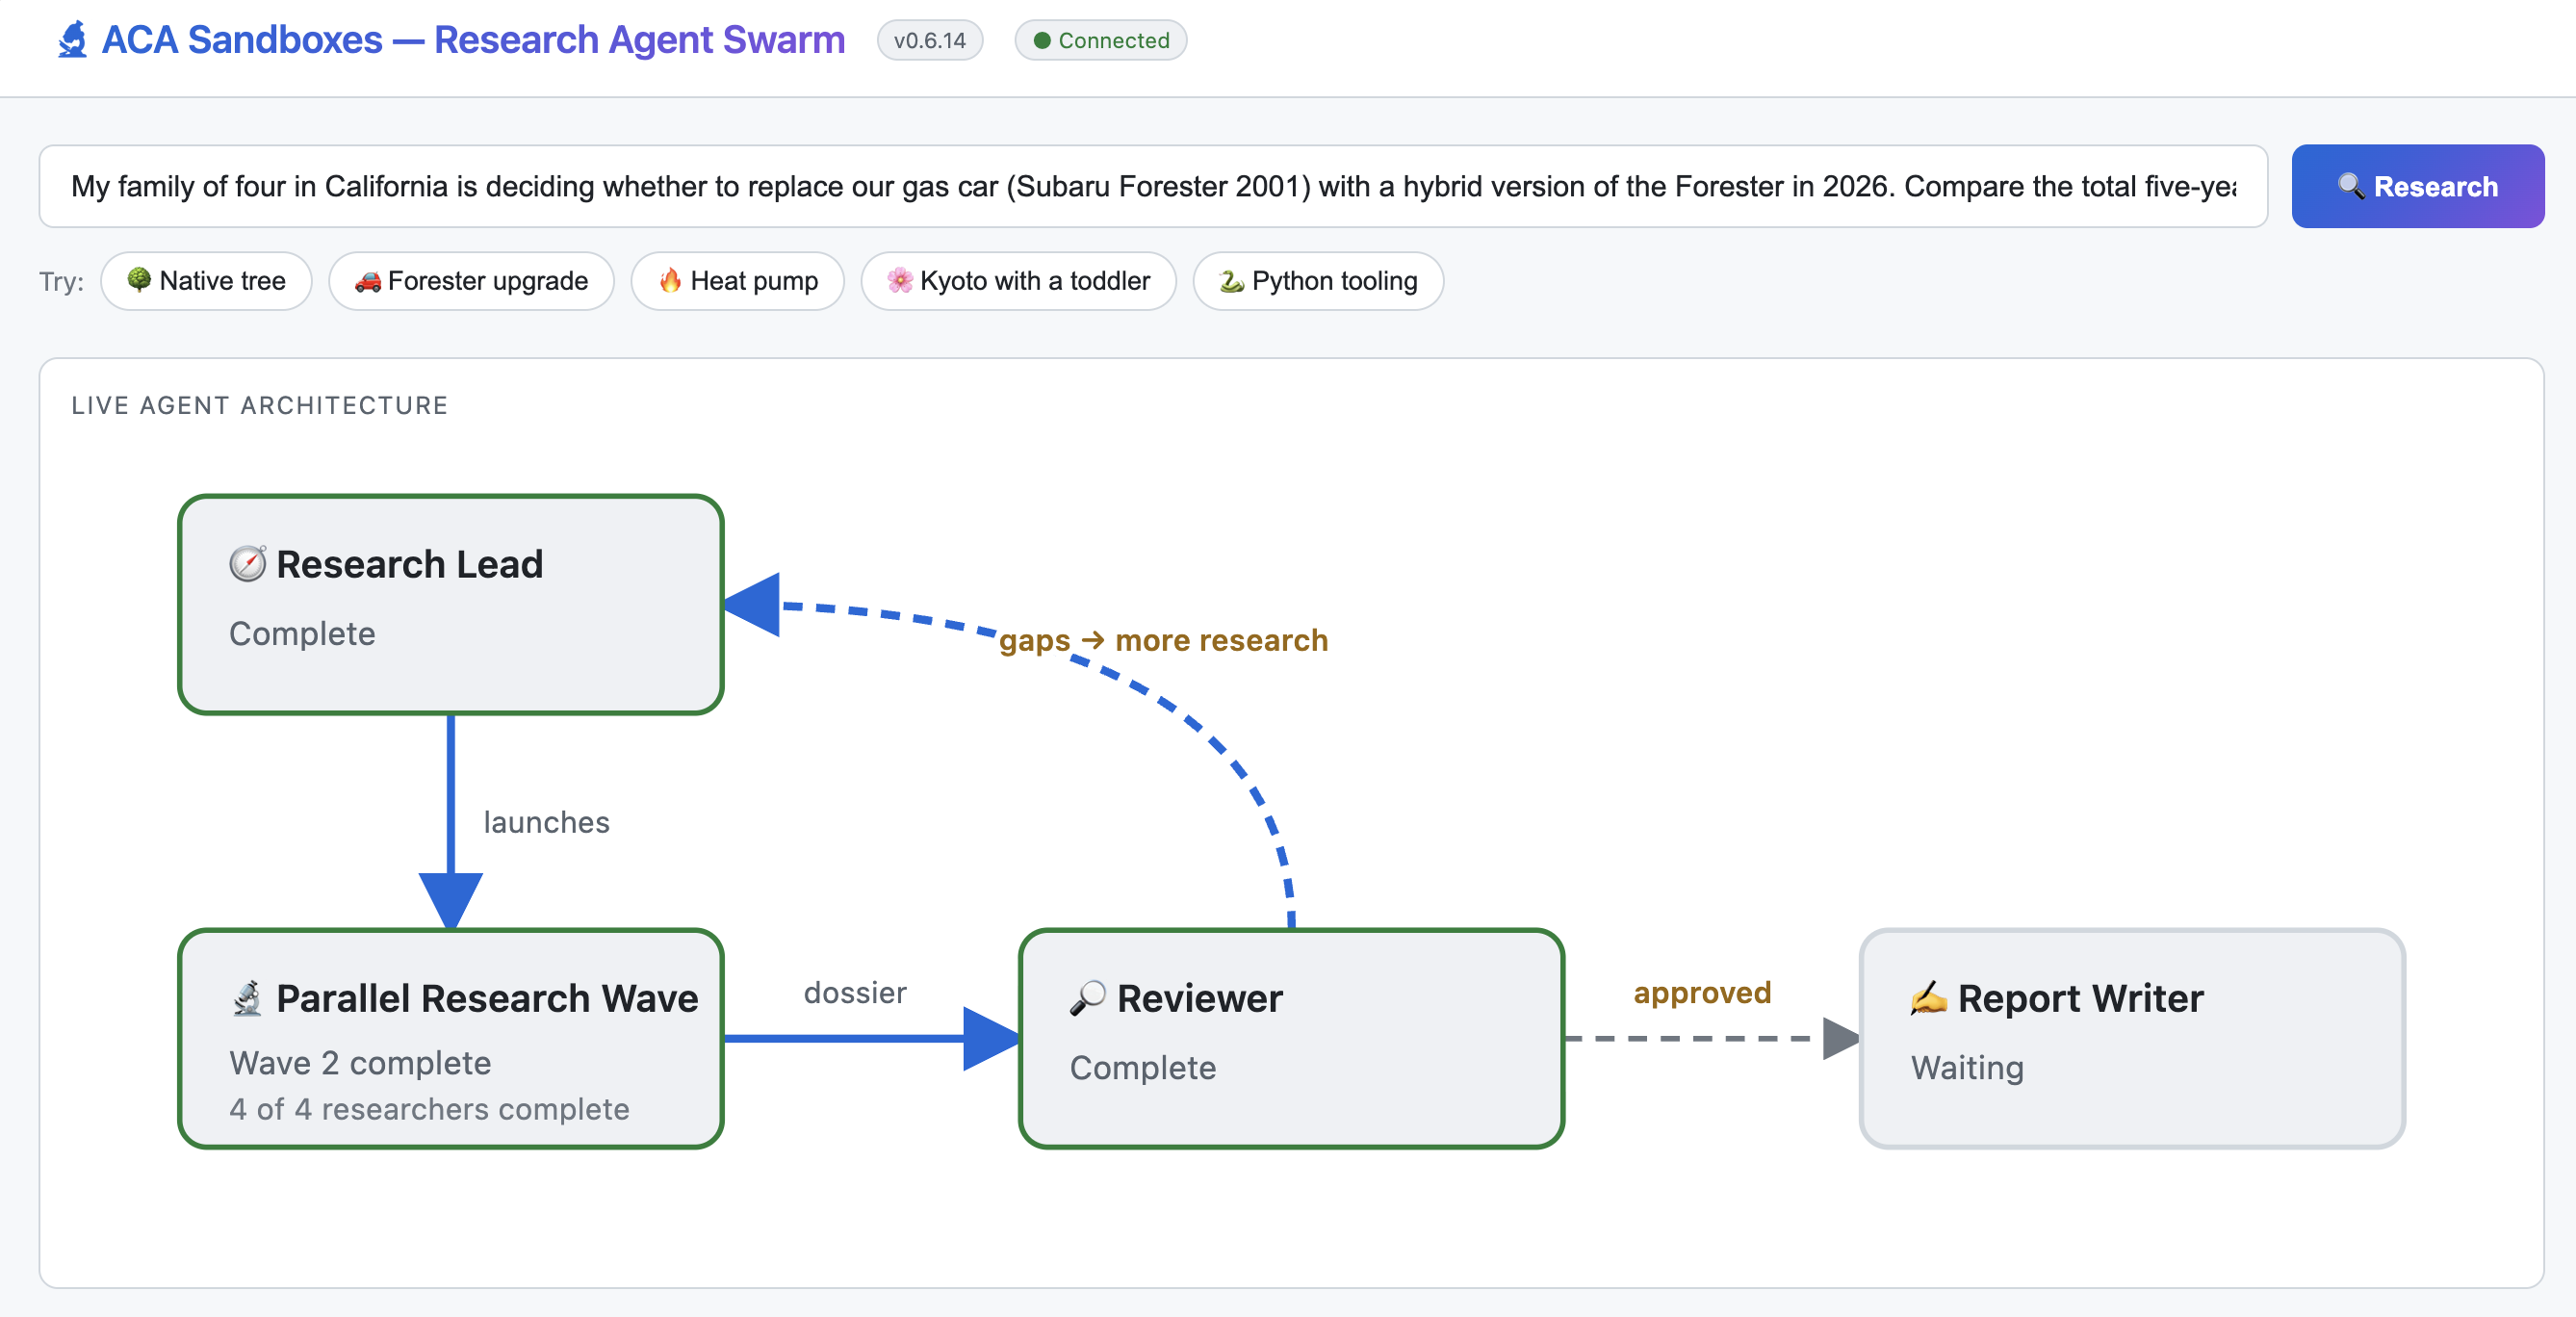
Screenshot: the Forester upgrade sample after a second research wave, with the Reviewer's two routes visible (gaps back to the Planner, approved on to the Report Writer).
Switch to the live app. Submit a sample topic early and narrate while it runs: the planner's plan, researchers provisioning,
researching, done. Briefly open portal.azure.com and show the live sandboxes in the sandbox group while they exist.
Inspect the final report. Backup: have a completed report and a captured sandbox list ready rather than waiting silently.
Swarm architecture
User question ↓
Container · orchestrator
Sandboxes
question →
question →
question →
Each sandbox has its own execution boundary.
↓ Final report
Sandbox lifecycle: create sandbox → run research → collect result → delete
Build 1: the work. Question, planner, parallel researcher branches, fan-in, review, report. Three branches for readability; the sample supports up to six.
Build 2: where it runs. The orchestrator runs in an ordinary container. Each question goes straight to its own sandbox;
the research agent, with its model calls and web search, runs across that boundary. The arrows summarize the sandbox lifecycle (create, run, collect, delete). Keep this vendor-neutral: container versus sandbox. Azure names come on slide 6.
Walk back through what the audience just saw in the demo, now with the hosting boundaries named.
Part 2 of 4
Sandboxes 101
Create, configure, secure, and keep state
Introducing the swarm
Sandboxes 101
Back to the swarm
Wrapping up
Now underneath the swarm: what a sandbox is, how to create one, and the controls that matter for agents: lifecycle, network, identity, and state. We'll use a single agent to keep it simple.
What is a sandbox?
Sandbox 1
Sandbox 2
Sandbox 3
Processes
Memory
Filesystem
Host
time
1 2 3
● Sub-second startup
✕ Deleted when done
Outbound network
Model API
Telemetry
Any other site
CPU ≤ 2 cores
RAM ≤ 4 GiB
Isolated Its own processes, memory, and filesystem. It can't see or change the host or other sandboxes.
Fast & disposable Sub-second startup for one task, then gets deleted when the task is done.
Bounded Gets only the network endpoints, credentials, and CPU and memory you allow for its task.
Before any Azure specifics: what is a sandbox? The architecture put each research process in one; here is what that means.
Isolated: separation you get by default. Each sandbox has its own processes, memory, and filesystem, so model-driven code can't see or change the host or the other branches. How that separation is enforced varies: containers share the host kernel, gVisor adds a user-space kernel, and microVMs give each sandbox its own kernel. We'll see which one Azure uses later.
Click 1, fast and disposable: the lifetime bars. Each sandbox starts in under a second for one task and is deleted afterward, so six branches can start at once and nothing lingers.
Click 2, bounded: limits you configure per task. The network allowlist and the CPU and memory numbers are examples, not defaults. Allowed network endpoints, scoped credentials, and CPU and memory caps, so a misbehaving branch can only call approved services and use its own resources.
Next: how Azure Container Apps provides this.
Azure Container Apps Sandboxes
Fast, isolated, and stateful compute infrastructure on demand.
Execute securely by default Sandbox isolation for any untrusted workload
Resume instantly Preserve state across stop and resume, with enterprise controls
Burst to hyperscale Sub-second start, zero to thousands, no compute cost when idle
The foundation layer used by:
Mental model in one sentence: a sandbox group holds sandboxes, and each sandbox boots from a disk image, which can come from your own OCI image.
Pillars preview later slides: isolation, resume, burst and scale-to-zero.
Precision: sub-second start comes from prewarmed pools; it doesn't mean first-time custom image preparation is sub-second, and restoring from a snapshot needs a short warm-up.
"No compute cost idle": stopped sandboxes have no vCPU/memory charges, but storage for custom disk images, snapshots, and volumes will be billed (coming soon).
How products use it (if asked): Copilot's cloud sandbox is an ACA Sandbox internally; Foundry hosted agents run on Sandboxes;
Express cut provisioning from 14-20 minutes to under a minute and cold start from ~20s to sub-second; SRE Agent runs Python and hosted tools in Sandboxes;
Copilot Studio's new harness runs each custom agent in its own sandbox with a data disk volume for memory.
Don't demo copilot --cloud. Don't claim Copilot-from-Teams uses it.
Anatomy of a sandbox on Azure
SANDBOX GROUP SANDBOXES sandbox-1 Running M — 1 core / 2 GiB / 20 GiB ingress: port 8080 sandbox-2 Running L — 2 cores / 4 GiB / 40 GiB sandbox-3 Stopped M — 1 core / 2 GiB / 20 GiB ingress: port 8080 sandbox-4 Stopped S — 0.5 cores / 1 GiB / 10 GiB SHARED RESOURCES Disk Images root filesystems Snapshots memory + disk Data Volumes blob · data disk Secrets egress credential injection Identity managed identity Internet / VNet Ingress proxy PER-SANDBOX POLICIES off by default opt-in per port Egress proxy PER-SANDBOX POLICIES open by default allow / deny host rules credential injection injected credentials stay outside the sandbox Internet / VNet
Before creating a sandbox, you need somewhere to put it. A sandbox group is the regional, top-level resource that contains sandboxes
and the configuration they share: disk images, snapshots, data volumes, secrets, and identity. It's the security and configuration boundary.
Create it once with the portal, the aca CLI, or the SDKs (control plane), then create and delete sandboxes inside it (data plane),
which needs the SandboxGroup Data Owner role at the group scope. No Container Apps environment or deployed app required.
Briefly point at the edges; we'll come back to both: ingress is off by default and opt-in per sandbox and port;
egress goes through the egress proxy and is open unless you set a per-sandbox egress policy (allow/deny host rules, credential injection). In the swarm, one group holds every researcher's sandbox.
Size presets are CPU / memory / disk, from the portal's create form: XS 0.25 cores / 512 MiB / 5 GiB, S 0.5 / 1 GiB / 10 GiB, M 1 / 2 GiB / 20 GiB (default), L 2 / 4 GiB / 40 GiB, XL 4 / 8 GiB / 80 GiB.
Diagram adapted from https://sandboxes.azure.com/docs/sandboxes/
Create a sandbox group
resource group 'Microsoft.App/sandboxGroups@2026-02-01-preview' = {
  name: 'my-sandbox-group'
  location: 'westus2'
}

var dataOwner = 'c24cf47c-5077-412d-a19c-45202126392c'

resource access 'Microsoft.Authorization/roleAssignments@2022-04-01' = {
  name: guid(group.id, principalId, dataOwner)
  scope: group
  properties: {
    roleDefinitionId: subscriptionResourceId(
      'Microsoft.Authorization/roleDefinitions', dataOwner)
    principalId: principalId
  }
}
az group create --name my-rg --location westus2

aca sandboxgroup create -g my-rg \
  --name my-sandbox-group \
  --location westus2 \
  -s "$SUBSCRIPTION_ID" --set-config

aca sandboxgroup role create \
  --group my-sandbox-group \
  --role "Container Apps SandboxGroup Data Owner" \
  --principal-id "$PRINCIPAL_ID"
Create the group once; every sandbox lives inside it. In the Bicep, dataOwner is the built-in role ID for Container Apps SandboxGroup Data Owner. Both paths do two things: create the regional sandbox group, and grant the caller
the Container Apps SandboxGroup Data Owner role on it, which data-plane calls (create, exec, delete) require. RBAC can take a minute to propagate.
There's no az command for sandbox groups yet: az creates the resource group, and the aca CLI creates the group.
--set-config saves the group, subscription, and region into aca config so later commands don't need them. Run aca doctor to verify.
The portal can also create a group (Create, then subscription, resource group, name, region). Later we'll extend this Bicep to pull images from ACR.
Create a sandbox from the portal
📎 portal.azure.com
Switch to portal.azure.com and demo the portal flow (steps from the Learn portal quickstart, which is written for sandboxes.azure.com; the Azure portal has the same features):
Create a sandbox group (subscription, resource group, name, region), then + Create sandbox, Ubuntu disk image, default 1 vCPU and 2 GiB.
Open the sandbox: a browser terminal attaches. Demo commands (verified on the ubuntu image):
Its own Linux machine: whoami, uname -a, cat /etc/os-release
Its own kernel: dmesg | head -2 shows [0.000000] Linux version 6.12.8+ ..., the boot log of a kernel that started seconds ago just for this sandbox (a container never sees its own kernel boot). The docs: "Isolated microVMs... each sandbox runs in its own secure boundary with its own kernel." Optional extras: grep -m1 -o hypervisor /proc/cpuinfo, cat /proc/cmdline (root=/dev/vda, console=hvc0).
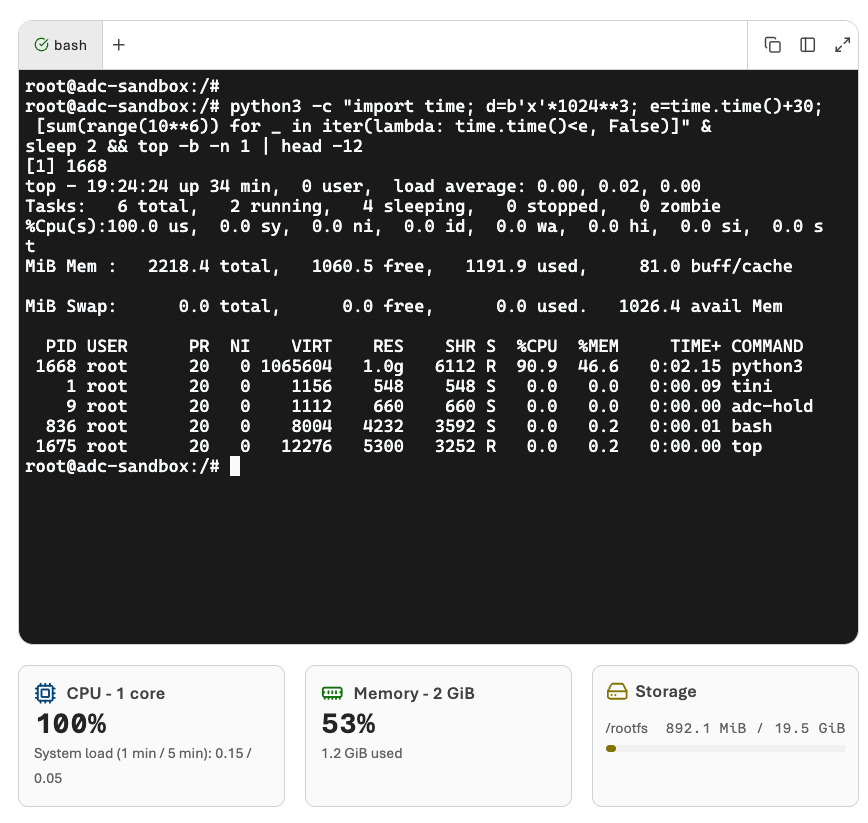
The size I picked (M = 1 core / 2 GiB / 20 GiB): nproc, free -h, df -h /
It can reach the internet (egress is open with no policy): curl -s https://api.github.com/zen
or python3 -c "import urllib.request; print(urllib.request.urlopen('https://api.github.com/zen').read().decode())".
Sets up the later allowed/blocked demo: same command after a deny policy.
Run code: python3 -c "import platform, os; print(platform.python_version(), os.cpu_count(), 'cores')"
Optional, NOT yet verified: ingress. python3 -m http.server 8080 --bind 0.0.0.0, then add port 8080 in the sandbox's Ports settings and open the generated URL. Must bind 0.0.0.0, not 127.0.0.1.
Then stop or delete it from the toolbar.
Use the sandbox group created on the previous slide (create it ahead of time so provisioning isn't live waiting time).
Besides the standard sandbox, the Create menu has GitHub Copilot and Claude templates that inject a stored GitHub PAT or Anthropic key at start;
unlike egress injection later, those credentials land inside the sandbox.
Next slide: the same thing from code.
Create a sandbox programmatically
aca sandbox create --disk ubuntu --label name=demo
aca sandbox exec -l name=demo -c "uname -a"
aca sandbox delete -l name=demo --yes
/plugin marketplace add microsoft/azure-container-apps
/plugin install sandboxes@Azure-Container-Apps

> Create an Ubuntu sandbox and run uname -a
sandbox = client.begin_create_sandbox(
    disk="ubuntu").result()
result = sandbox.exec("uname -a")
print(result.stdout)
sandbox.delete()
const poller = groupClient.sandboxes.beginCreate({
  sourcesRef: {
    diskImage: { name: "ubuntu", isPublic: true } },
});
const sandbox = await poller.pollUntilDone();
const result = await groupClient.sandboxes
  .exec(sandbox.id, { command: "uname -a" });
await groupClient.sandboxes.delete(sandbox.id);
The same create, run, delete flow from code. All four assume a sandbox group already exists
(Bicep and Terraform quickstarts cover creating the group; sandboxes themselves are data-plane objects, not ARM resources).
CLI: --label sets a label at creation; -l selects by label afterward. Install with curl -fsSL https://aka.ms/aca-cli-install | sh.
Python and TypeScript SDKs are beta today (.NET beta soon, stable SDKs by Ignite). The Python client setup is omitted here: SandboxGroupClient(endpoint_for_region(region), credential, subscription/resource group/sandbox group). We'll see it in the swarm code later.
Agent Skill: installs a skill that teaches a coding agent the aca CLI, so it can create sandboxes, run commands, and set egress from natural language. Claude Code: claude plugin add microsoft/azure-container-apps.
Inside a sandbox
Each sandbox runs as a hardware-isolated microVM with its own Linux kernel , own virtual hardware , and memory separation enforced by CPU virtualization .
Typical containers
Shared host kernel
Physical host
Sandboxes
Your code
Container image
Guest kernel
Your code
Container image
Guest kernel
Your code
Container image
Guest kernel
Hardware-isolated microVM boundary
Physical host
This is what we just saw in the terminal: dmesg showed a kernel that booted seconds ago, just for that sandbox, on its own virtual disk and console.
Each sandbox is a microVM: its own kernel and virtual hardware, with memory separation enforced by the CPU, not by kernel permissions.
Left: ordinary containers share one host kernel, so a kernel bug or escape affects everything on the machine. Right: your container runs the same way, but each sandbox is its own microVM (dashed outline) with its own guest kernel. The boundary is hardware-isolated, enforced by the CPU (Intel VT-x / AMD-V), not by kernel permissions and not by policy. Verbally: that's hardware virtualization, the job a hypervisor does; the ACA team doesn't document the hypervisor itself.
"Guest kernel" is the virtualization term for the kernel a VM boots; "host kernel" is the machine's own. Each sandbox's guest kernel is the one dmesg showed booting.
Key points (previously on the slide): Your container runs exactly the way it always has; what changes is what's underneath it.
That's a stronger boundary than a typical container runtime, which shares the host kernel with everything else on the machine.
Left caption: a kernel bug or escape affects everything on the machine. Right caption: your container runs the same way; each one gets its own kernel.
The top two layers are yours: your code and your container image. So far we used the built-in ubuntu image; next, how to bring your own.
In the swarm, the trusted orchestrator stays outside every researcher's sandbox: one task, one workspace, no shared filesystem or process space.
Caveat: this is a boundary, not a guarantee about your code. Anything you deliberately place inside a sandbox (credentials, mounted data, allowed network destinations) is available to whatever runs there. That sets up the next questions: egress, identity, and data.
Optional demo beat: two sandboxes with separate files and processes. That illustrates separation; it isn't proof that escape is impossible.
Bring your agent image
Example: Dockerfile for Python agent
FROM python:3.12-slim

RUN apt-get update \
    && apt-get install -y --no-install-recommends \
       bash git \
    && rm -rf /var/lib/apt/lists/*

WORKDIR /app
COPY requirements.txt .
RUN pip install --no-cache-dir -r requirements.txt
COPY sandbox_agent.py .

RUN mkdir -p /workspace
WORKDIR /workspace
CMD ["sleep", "infinity"]
📎 sandbox-agent/Dockerfile
Same as any container
1 Build your imagedocker build -t myagent .
2 Push to a registry, e.g. ACRdocker push myreg.azurecr.io/myagent
Sandboxes
3 Import as a disk imagedisk = client.begin_create_disk_image(image)
4 Create sandboxes from itclient.begin_create_sandbox(disk_id=disk.id)
So far we used the built-in ubuntu image, but we can also bring our own.
Steps 1-2 are what you already do for any container. Steps 3-4 are the Sandboxes part: the sandbox group imports the OCI image as a disk image (the root filesystem a microVM boots from), and you create sandboxes by disk image ID instead of disk="ubuntu".
CLI: aca sandboxgroup disk create --image <registry/image>, then aca sandbox create --disk-id <id>. SDK: begin_create_sandbox(disk_id=...).
The docs list three disk image sources: public (ubuntu, nginx, copilot), custom from a registry (this slide), or committed from a running sandbox's filesystem.
ACR is an optional registry choice for bringing your own image, not a prerequisite. It stores the OCI image; it doesn't run the agent.
Building/pushing the OCI image, preparing a sandbox disk image, and creating the sandbox are three separate steps.
The container just sleeps; the agent is started later with sandbox.exec.
Pulling from a private registry: attach a managed identity to the sandbox group, point its image registry credentials at the registry, and grant that identity AcrPull on the registry (see infra/main.bicep). Attaching the identity alone doesn't authorize the pull.
The pull is fully keyless: ACR admin credentials are disabled, and the disk-image API's v2 endpoint authenticates with the group identity's client ID (source.managedIdentityClientId).
Two planes: Bicep/ARM provisions the group, registry, identity, and role assignments; disk images and sandboxes are data-plane objects, not Bicep resources.
Transition: now let's create a sandbox from this image, and look at everything else we can configure.
Sandbox configuration
sandbox = client.begin_create_sandbox(
disk_id=disk.id,⟶ What it boots
cpu="1000m", memory="2048Mi",⟶ How big it is
auto_suspend_seconds=300,⟶ When it goes idle
egress_policy=deny_by_default,⟶ Where it can connect
ports=[8080],⟶ Who can reach it
volumes=[workspace_volume],⟶ What data it keeps
).result()
📎 create_sandbox.py
Everything about a sandbox is set when you create it. This one call is a map of what's coming: we just covered the image, and the sizes (cpu/memory) came up in the portal demo; next is lifecycle (auto_suspend_seconds), then the rest one at a time.
disk_id replaces disk="ubuntu" now that we have our own image. cpu/memory default to 1000m and 2048Mi (the M size). auto_suspend_seconds defaults to 300; auto_suspend_mode picks Memory or Disk.
egress_policy (shown as deny_by_default = EgressPolicy(default_action="Deny")) is explicit because with no policy, outbound access is unrestricted. ports publishes a port for ingress (off by default). volumes attach storage that outlives the sandbox.
Other real parameters, if asked: disk_size, labels, environment, connections, entrypoint/cmd.
Client setup (not shown): SandboxGroupClient(endpoint_for_region(region), credential, subscription_id=..., resource_group=..., sandbox_group=...). Creating a client doesn't create a sandbox; an async client exists for fan-out.
begin_create_sandbox is a long-running operation; .result() waits until it's running. Then sandbox.exec(...) runs commands and sandbox.delete() removes it.
Sizes: XS (0.25 cores, 0.5 GB) up to XL (4 cores, 8 GB, 80 GB disk); M (1 core, 2 GB) is the default. The swarm uses 0.5 cores and 1 GiB per researcher.
Sandbox lifecycle
LIFECYCLE POLICY
Create
Running
Stopped
Idle timeout or stop command
stopping ·
snapshotting
resuming
Network traffic or start command
Auto-delete
policy
Delete
📎 Sandbox lifecycle docs
The lifecycle policy has two parts: auto-suspend (idle timeout plus a suspend mode, Memory or Disk) and auto-delete for sandboxes that stay stopped.
Stopping snapshots the disk, and optionally memory; resuming from stopped takes under a second.
Policies move sandboxes between states, so your application doesn't have to poll. Stopped sandboxes have no compute charges and don't count against the Sandbox Cores quota.
Sandboxes with a data-disk volume can only use Disk mode.
SDK: sandbox.set_lifecycle_policy(LifecyclePolicy(auto_suspend=AutoSuspendPolicy(...), auto_delete=AutoDeletePolicy(...))). CLI: aca sandbox lifecycle set.
stop() and resume() are explicit alternatives. Don't explain what causes Disabled; the docs only say it can't start until re-enabled. States, checked September 29: the docs and the live API use Running and Stopped. Every stopped sandbox in our group, including auto-suspended ones, reported state Stopped with stoppedReason Idle; the SDK also lists UserStopped for manual stops. The SDK's type hints still list a Suspended state (and Stopping, Resuming, Creating, Deleting as transitions), but the service didn't return Suspended. The docs call Disabled a third state; the SDK models it as a stop reason.
We'll come back to cleanup on the limits slide.
Next: what survives a stop, depending on the suspend mode.
Close isn't delete: closing an SDK client (close(), or an ExitStack callback) only releases local connections. Delete the sandbox explicitly, and keep an auto-delete policy as the backstop for sandboxes left stopped. Auto-suspend isn't a hard execution deadline.
Auto suspend mode with memory or disk
sandbox = group.begin_create_sandbox(
      ...,
      auto_suspend_mode="Memory"  # or "Disk"
	).result()
sandbox.begin_stop().result()     # also happens after auto_suspend_seconds idle
sandbox.begin_resume().result()   # or send it network traffic
Disk
Files ✓
Running processes: restart them ✗
Memory
Files ✓
Running processes and memory ✓
Stopped sandboxes have no compute charges and don't count against your cores quota.
Resume continues the same sandbox; a snapshot creates a new one. Both bring local state forward.
Tested against our sandbox group: a background counter plus a file, then begin_stop and begin_resume. Memory mode: the counter kept counting from where it stopped, resume 0.6 s. Disk mode: the file was there but the process was gone, resume 0.9 s. Stopping in Memory mode took longer (about 8 s, versus about 1 s for Disk) because it captures memory.
The mode is set per sandbox at create time (auto_suspend_mode) or in the lifecycle policy (AutoSuspendPolicy(mode=...)); stop() uses it. Sandboxes with a data-disk volume can only use Disk mode.
The swarm doesn't suspend: every researcher sandbox is deleted after its result is collected. Suspend fits long-lived agents that wait on people or events.
CLI: aca sandbox stop / aca sandbox start.
Demo: Suspend and resume a sandbox
1 Running A background counter adds 1 every second.
2 Stopped Memory and processes are saved. No compute charges.
3 Resumed The same process keeps counting, not back at 1.
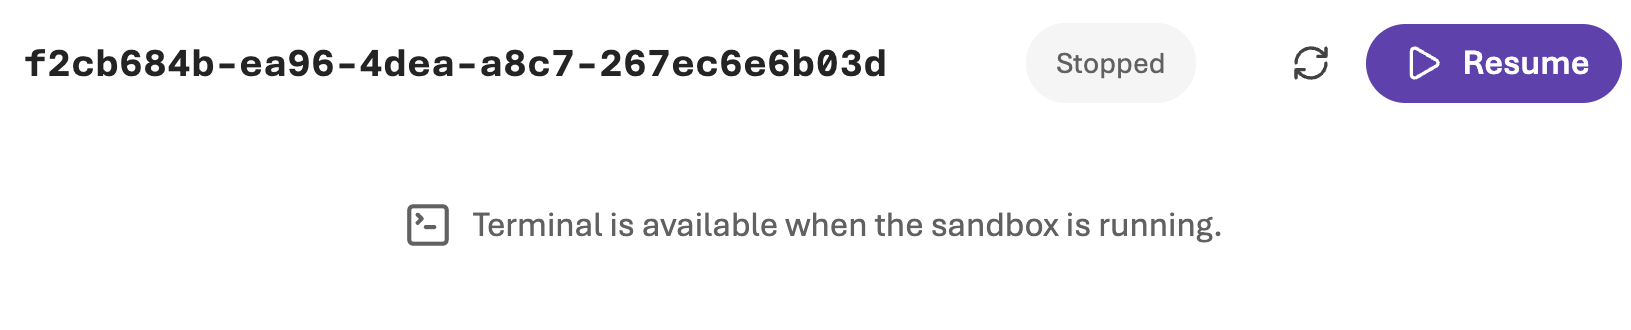
Portal walkthrough on sandbox f2cb684b (name: suspend-demo, Memory suspend mode, plain Ubuntu). A background loop writes an incrementing number to /tmp/counter once a second:
nohup sh -c 'i=0; while true; do i=$((i+1)); echo $i > /tmp/counter; sleep 1; done' >/dev/null 2>&1 &
In the terminal: cat /tmp/counter; sleep 2; cat /tmp/counter. Then Stop, wait for Stopped, Resume, and run it again.
The counter continues from where it was, and it's still climbing, so the same process survived. In Disk mode, the file would survive but the loop would not.
Creating it: python create_sandbox.py --disk ubuntu --name suspend-demo --suspend-mode Memory. Stopping in Memory mode takes a few seconds longer because it captures memory.
Snapshots: new sandboxes from saved state
↓ begin_create_snapshot()
📸 Snapshot: first-draft
Owned by the sandbox group, outlives the sandbox
begin_create_sandbox(snapshot_id=...)
↓ ↓
✓ Files, running processes, memory, env vars
Suspend and resume continues the same sandbox. A snapshot captures that same state (files, memory, running processes) and lets you create new sandboxes from it: a checkpoint before a risky step, or one warmed-up state that many sandboxes start from.
Tried with the standalone agent: create_sandbox.py --snapshot-after-run first-draft captures the sandbox after the run; --snapshot-id starts a new one from it. The snapshot took about 1.6 s and the restore about 0.4 s. A background process kept counting after restore, so memory comes back, not just disk. That also means in-process credentials and environment variables come back.
A restore uses the snapshot's CPU, memory, and disk; you can't resize on restore. Our swarm starts from a disk image instead, but a snapshot is the way to fan out from a warmed-up state.
Snapshots belong to the group and outlive their source sandbox, with no automatic retention; clean them up. Retained storage will be billed at Premium Blob ZRS rates (coming soon).
Demo: python create_sandbox.py --snapshot-after-run first-draft --delete-after-run --prompt "Write report.md: three bullets on why agents need sandboxes." Then: python create_sandbox.py --snapshot-id <id> --delete-after-run --prompt "Add a fourth bullet about cost to the report."
Volumes: storage that outlives sandboxes
group.create_volume("agent-output")

writer = group.begin_create_sandbox(
    disk_id=agent_disk.id,
    volumes=[SandboxVolume(
        volume_name="agent-output",
        mountpoint="/workspace/out")],
).result()

reader = group.begin_create_sandbox(
    disk="ubuntu",
    volumes=[SandboxVolume(
        volume_name="agent-output",
        mountpoint="/data", read_only=True)],
).result()
📎 Sandboxes docs · 📎 create_sandbox.py
📦 Writer sandbox
Saves report.md to /workspace/out, then is deleted
↓ write
🗄️ Volume: agent-output
Azure Blob storage owned by the sandbox group
↓ mount read-only
📦 Reader sandbox
Any image, any time later
✓ Reads /data/report.md
✗ Writes to /data: read-only file system
Files inside a sandbox are private to it and gone when it's deleted. A volume is the deliberate way to keep files and share them across the boundary.
Tried with the standalone agent: create_sandbox.py --volume agent-output mounts a group volume at /workspace/out, and the agent is told to save final deliverables there. Delete the sandbox, then mount the same volume in a new one (even plain Ubuntu) and the report is there. It's Azure Blob storage mounted with blobfuse; a read-only mount really rejects writes ("Read-only file system").
Unlike a snapshot, a volume holds only the files you put in it: no memory, no processes. It can be mounted by many sandboxes and outlives all of them. A volume mount also survived a snapshot restore in testing.
Other volume types: DataDisk (a sized disk; sandboxes using one can only suspend in Disk mode) and AzureBlobByo (your own storage container, authenticated with a managed identity).
Disk images should be trusted starting points: code and dependencies, not credentials or another task's data. Put task outputs in volumes instead.
Volumes aren't deleted with the sandbox; clean them up. Retained storage will be billed at Premium Blob ZRS rates (coming soon).
Demo: python create_sandbox.py --volume agent-output --delete-after-run --prompt "Write report.md: three bullets on why agents need sandboxes." Then: python create_sandbox.py --disk ubuntu --volume agent-output --delete-after-run --command "cat /workspace/out/report.md"
Next: the network boundary, starting with where code inside a sandbox can connect.
Network egress: Making outbound calls
github_rule = EgressRule(
    match=EgressRuleMatch(host="api.github.com",
                          methods=["GET"]),
    action=EgressRuleAction(type="Allow"))
policy = EgressPolicy(
    default_action="Deny",
    traffic_inspection="Full",
    rules=[github_rule])
group.begin_create_sandbox(..., egress_policy=policy)
📎 Control egress · 📎 create_sandbox.py
↓ all outbound traffic goes through the proxy
Egress proxy outside the sandbox
Inspect host, path, methodMatch rules in order, first match winsNo match → default action DenyInject auth headers (never inside the sandbox) Record the decision in network audit logs
✓ GET api.github.com
✗ everything else
Left: the standalone agent's actual policy (agent_egress_policy in create_sandbox.py). Default Deny, Full inspection, and read-only GitHub. The real policy has one more rule, for the model endpoint: a Transform rule that has the proxy add an Authorization header. That's the next slide. A POST to GitHub matches neither rule, so it gets the default Deny. Transform headers can also come from a group secret (secretRef), e.g. a GitHub token. Egress is opt-in: with no policy, outbound access is unrestricted.
Right: why it's hard to get around. The policy is enforced outside the sandbox, so code inside (even as root) can't edit or skip it. Changing proxy env vars or routes inside the VM doesn't help; all outbound traffic goes through the proxy. The VNet docs say so directly: VNet connections "do not change the egress proxy posture; outbound traffic still flows through the proxy." Under the hood each microVM has a single virtual NIC (confirmed by the ACA team; the boot log showed one eth0 on a private link).
Fails closed: no matching rule means the default action (Deny); an egress webhook that fails also defaults to Deny (failBehavior).
Secrets stay outside: Transform headers are added by the proxy after the request leaves the sandbox, so the token never exists inside it for code to steal.
Every decision is recorded (Network audit in the portal, aca sandbox egress decisions, sandbox.get_egress_decisions()).
Caveats: an allowed destination is still a path for data to leave. Full inspection terminates TLS at the proxy, which is why research-agent/app.py disables certificate verification; it's a sample shortcut, don't recommend verify=False.
Whoever creates the sandbox controls the policy (begin_create_sandbox even has skip_egress_proxy); code inside the sandbox doesn't.
More rule options: actions Allow, Deny, Transform (modify headers), Rewrite (change destination); inspection Full (blocks non-HTTP), Partial, None; path and method matches need Full.
CLI: aca sandbox egress set -l <selector> --default Deny --rule "*.github.com:Allow" --traffic-inspection Full, or a YAML policy with aca sandbox egress apply --file egress.yaml.
Swarm version (orchestrator/sandbox_manager.py): default Deny, Transform rules for the Foundry project and Azure OpenAI hosts that inject the group identity's token (next slide), and an allow rule for Application Insights. Hosted web search runs inside Foundry, so no search-engine egress is needed.
Sources: "outbound traffic still flows through the proxy" is in the VNet docs (sandboxes.azure.com/docs/sandboxes/sandbox/vnet); the single virtual NIC is confirmed by the ACA team but not in public docs, so say it rather than putting it on the slide.
Outbound calls with credential injection
Egress rule: add a token for the group's identity
group_identity_token = EgressHeaderValueRef(
    managed_identity_ref=EgressManagedIdentityRef(
        identity_type="UserAssigned",
        identity_resource_id=group_identity_id,
        resource="https://cognitiveservices.azure.com",
        format="Bearer {value}"))
model_rule = EgressRule(
    match=EgressRuleMatch(
        host="myai.cognitiveservices.azure.com"),
    action=EgressRuleAction(type="Transform", headers=[
        EgressHeader(name="Authorization",
                     value_ref=group_identity_token)]))
policy = EgressPolicy(..., rules=[model_rule, github_rule])
Inside the sandbox: a placeholder key
AsyncOpenAI(base_url=endpoint + "/openai/v1/",
            api_key="injected-by-egress-proxy")
📎 Sandbox identity · 📎 create_sandbox.py
Sandbox group
Sandbox
Sends a placeholder key
Managed identity
shared by its sandboxes
↓ request to the model host
Egress proxy outside the sandbox
Match the Transform ruleGet an Entra token for the group's identitySet Authorization
↓ request + group identity's token
Azure OpenAI
Role: Cognitive Services OpenAI User
The one thing to remember: a sandbox group can have a managed identity, just like other Azure resources, and requests from its sandboxes can carry Entra tokens for that identity. You grant it roles with normal Azure RBAC.
Left: the model rule from the previous slide, now with its value_ref spelled out (create_sandbox.py): a token for the group's user-assigned identity, audience https://cognitiveservices.azure.com. Below it, the agent's client in sandbox_agent.py, which only has a placeholder key. The swarm (orchestrator/sandbox_manager.py) does the same for its Foundry host with audience https://ai.azure.com, plus Azure OpenAI.
Right: code inside the sandbox needs an SDK credential object, so it hands over a placeholder; the proxy replaces the header after the request leaves the sandbox. The real token never exists inside the VM, so code there can't read or exfiltrate it. The proxy mints tokens as needed, so long-running agents don't hit token expiry.
The same identity pulls the image from ACR (AcrPull). Its roles here: AcrPull, Cognitive Services OpenAI User, Foundry User.
Separate permissions: whoever creates sandboxes needs Container Apps SandboxGroup Data Owner on the group. That's management, not model access.
Identity exists at the sandbox group level only, so every sandbox in the group gets the same access. For narrower access, use separate groups per trust level, or an egress webhook that decides per sandboxId (webhooks can only return literal header values).
Header values can also come from a group secret (secretRef) instead of an identity; group secrets are never exposed as environment variables.
Network rules decide reachability; authorization decides operations. You need both.
Contrast: the portal's Copilot and Claude templates put provider credentials inside the sandbox.
Next: the demo shows these egress rules and the audit log on a real sandbox.
Demo: Allowed and blocked requests
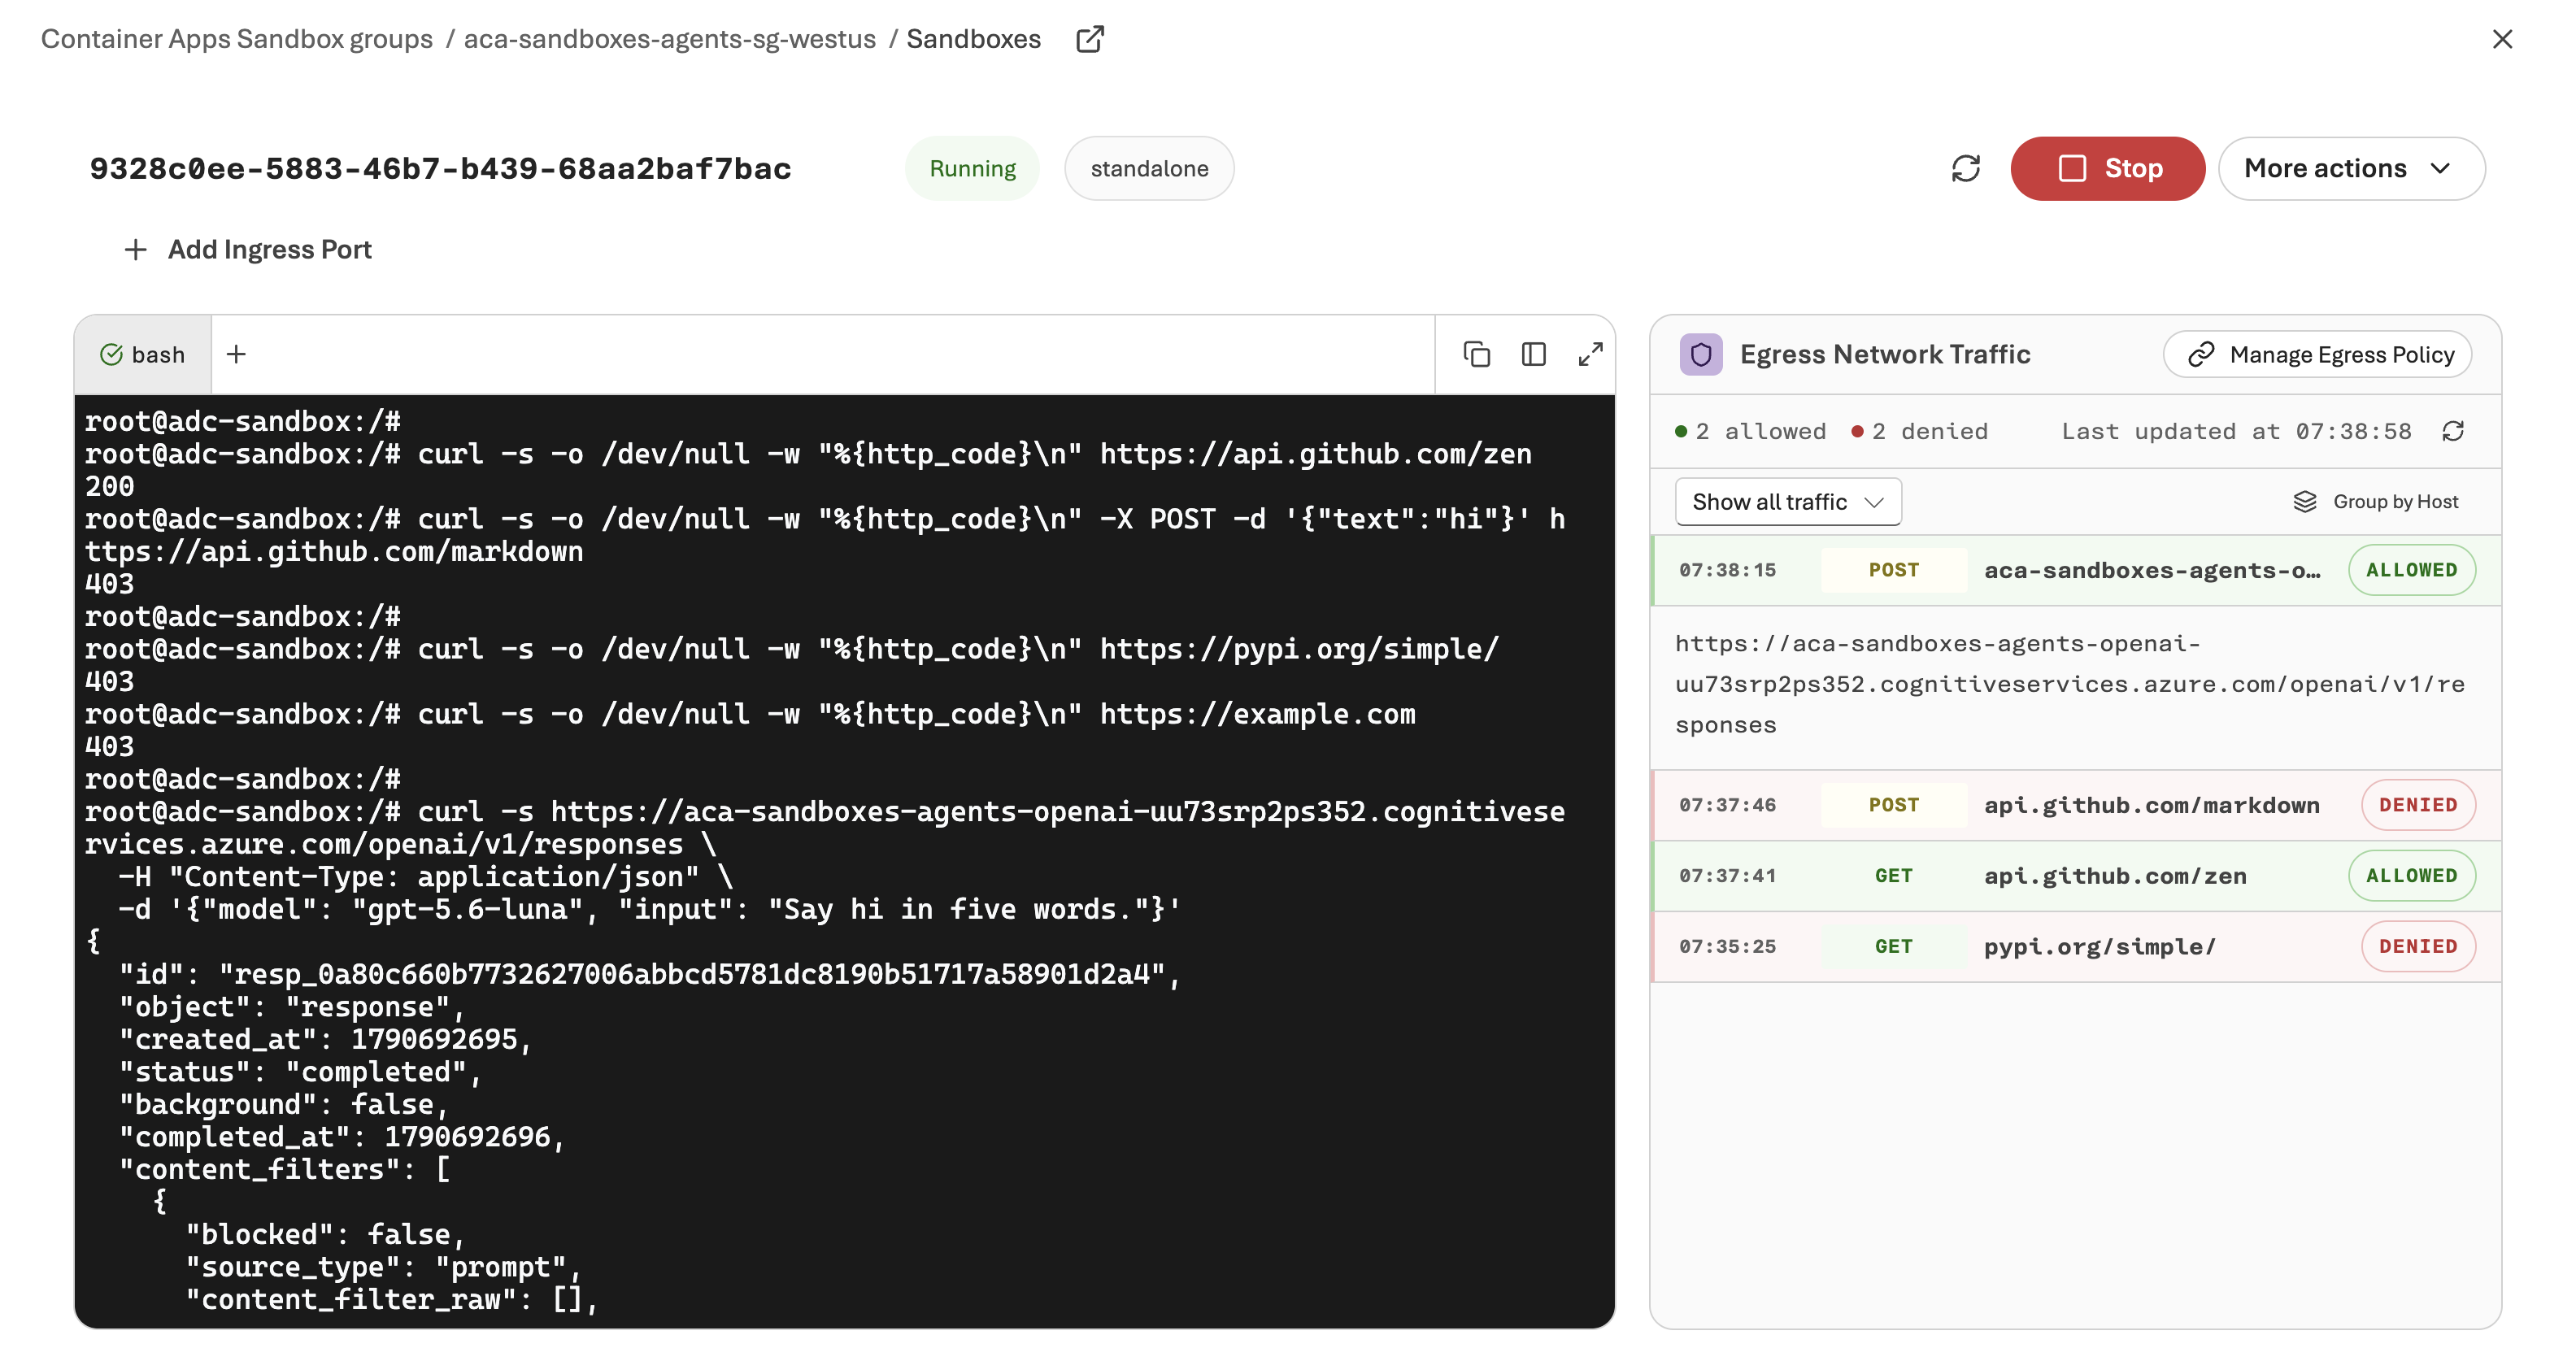
Run the repo's standalone agent with the policy from the last two slides (agent_egress_policy in create_sandbox.py):
Agent version: python create_sandbox.py --show-egress --prompt "Use Python to try these requests and report each HTTP status code in a table: GET https://api.github.com/zen, POST https://api.github.com/markdown with JSON {\"text\": \"hi\"}, GET https://pypi.org/simple/requests/, and GET https://example.com."
Curl alternative (the agent image includes curl, and --command runs get the same policy): python create_sandbox.py --command "curl ...", or curl in the sandbox's browser terminal in the portal. curl -s https://<model host>/openai/v1/responses with no Authorization header returns a real model answer: the proxy injected the token.
Expected: GitHub GET 200; the GitHub POST, pypi.org, and example.com 403 (the proxy answers fast, with an x-deny-reason header). The agent's own model calls work with no key in the sandbox: that's the injected identity token from the previous slide.
Then open the sandbox's Egress Network Traffic panel in the portal (or sandbox.get_egress_decisions(), aca sandbox egress decisions -l <selector> -o json). Tie each entry to the rule that explains it.
The audit log lags: the first allowed and denied entries show up within seconds, later ones can take minutes. --show-egress may print only part of the run; the portal fills in. The log can only be read while the sandbox is running (a stopped sandbox returns 409), and this sandbox auto-suspends after 5 idle minutes: open the panel right after the run, or resume the sandbox first. Backup: captured panel screenshot.
This demonstrates the rules, not universal protection against exfiltration. Decisions can also be exported continuously as NetworkEgressDecisions via telemetryConfig.
Network ingress: exposing internal ports
1 Run a server bound to 0.0.0.0
sandbox.exec("nohup python3 -m http.server 8080 "
             "--bind 0.0.0.0 &")
2 Publish the port to get a public HTTPS URL
port = sandbox.add_port(8080, anonymous=True)
print(port.url)
📎 Expose ports
↓ HTTPS to the port's public URL
Ingress proxy outside the sandbox
Off by default: only published ports have a URL
↓
Sandbox process on 0.0.0.0:8080
✓ port 8080 (published)
✗ every other port
Left: two steps. Run a server bound to 0.0.0.0 (not 127.0.0.1, or the proxy can't reach it), then publish the port to get a public HTTPS URL on the platform's proxy domain (*.{region}.adcproxy.io). To unpublish: sandbox.remove_port(8080); the URL stops working immediately.
Right: ingress is off by default, opt-in per sandbox and per port. Running a server and exposing its port are separate decisions, and outbound permission doesn't imply inbound access.
Anonymous means anyone with the URL can call it, so your app owns authentication. Next slides: who can call it, by IP range and by identity.
CLI: aca sandbox port add -l <selector> --port 8080 --anonymous. You can also publish at creation with begin_create_sandbox(ports=[8080]).
For private access instead of a public URL: link the group to a Container Apps environment in Express mode and add a private endpoint. Private linking changes ingress only; egress policy is unchanged.
In the swarm, the orchestrator polls status through an anonymous port. Incoming traffic also resumes a stopped sandbox (see lifecycle).
The proxy's placement outside the sandbox matches the docs architecture diagram (ingress proxy between the internet and the sandbox group).
Network ingress: IP access control
sandbox.add_port(8080, anonymous=True,
    ip_access_control=PortIpAccessControl(
        default_action="Deny",
        rules=[PortIpAccessControlRule(
            name="office", action="Allow",
            priority=10,
            source_cidrs=["203.0.113.0/24"])]))
📎 Expose ports
Rule office: allow 203.0.113.0/24
covers 203.0.113.0 to 203.0.113.255
203.0.113.7→ ✓ allowed
203.0.113.42→ ✓ allowed
No rule matches: default action Deny
198.51.100.4→ ✗ denied
IP access control is per port: a default action plus prioritized allow/deny rules on source IP ranges (CIDRs). The portal's default is Allow; this example flips it to Deny and allows one range.
203.0.113.0/24 means "the first 24 bits must match": any address from 203.0.113.0 to 203.0.113.255. Callers inside it get through; everything else falls to the default Deny.
Rules have a unique name and a unique priority. It combines with authentication: here the port is anonymous, so anyone on the office network can call it.
The SDK's add_port takes ip_access_control directly; update_ports with AddPortRequest sets every option at once.
To confirm with the ACA team: whether the IP check happens before or after authentication.
Network ingress: Allowed users
Anonymous
sandbox.add_port(8080, anonymous=True)
Teammate with the URL ✓
Stranger with the URL ✓
Script or crawler ✓
Microsoft Entra ID
sandbox.add_port(8080, email="pamela@contoso.com")
pamela@contoso.com, signed in ✓
Another Entra user ✗
Not signed in ✗
📎 Expose ports
Two choices per port. Anonymous: anyone who has the URL can call it, so the app inside owns authentication. The SDK logs a warning when you expose an anonymous port.
Microsoft Entra ID: only the listed users can call it. add_port(email=...) is a shortcut for one user; for several, use AddPortRequest(auth=PortAuthConfig(entra_id=PortAuthEntraId(enabled=True, emails=[...]))). You can't set both anonymous and Entra ID.
Entra ID auth is in the portal's Add Ingress Port form and the SDK, but not yet in the public ports docs.
To confirm with the ACA team: what a caller who isn't signed in gets (a sign-in redirect or a 401), and whether groups or apps can be allowed, not just emails.
Other port settings, if asked: Protocol (HTTP/1.1 or HTTP/2 between the proxy and your server; callers always use the HTTPS URL, and your server can speak plain HTTP) and Activation (Manual or OnDemand; OnDemand is expected to start a stopped sandbox when a request arrives). The portal form also has a CORS setting for browser callers from other origins.
Part 3 of 4
Back to the swarm
Sandboxes as a tool for parallel agents
Introducing the swarm
Sandboxes 101
Back to the swarm
Wrapping up
With every piece named, back to the swarm: how the orchestrator turns a sandbox into a tool, fans out, and traces the whole run.
Swarm architecture on Azure
Container Apps
Container Apps Sandboxes
question →
question →
question →
← disk image
egress →
egress →
Container Registry research-agent image Microsoft Foundry models + web search Application Insights telemetry
Same picture as the start of the talk, now with the Azure resources the sandboxes use.
Disk image: the research-agent image in ACR becomes a sandbox disk image, pulled by the group's managed identity.
Egress: default Deny, Transform rules for Foundry and Azure OpenAI, and an allow rule for Application Insights. Web search runs inside Foundry, so the sandbox never talks to a search engine.
Identity: the proxy injects a token for the sandbox group's identity; no token is placed in the sandbox.
Lifecycle: the orchestrator creates one sandbox per research question and deletes it after collecting the result.
No volumes or snapshots: each researcher's result comes back to the workflow directly, so nothing needs to outlive the sandbox.
Next: how the orchestrator turns a sandbox into a tool, then fans out.
Microsoft Agent Framework
Open-source SDK for building AI agents and multi-agent workflows · Python .NET Go preview
🤖 Agents
An LLM that calls tools and MCP servers, with Foundry, Azure OpenAI, OpenAI, Anthropic, and more.
Here: planner, researcher, reviewer, report writer
🔀 Workflows
Graph-based workflows that connect agents and functions through explicit paths: fan-out, fan-in, and handoffs.
Here: the swarm's parallel research waves
🧰 Harness agent
Batteries included for long, multi-step tasks: planning, todos, context compaction, file access, memory, and tool approval.
Here: the standalone sandbox agent
🔌 Integrations
Model providers, agent services, tools, context providers, middleware, evaluation, and observability.
Here: Foundry web search, OpenTelemetry tracing
📎 aka.ms/AgentFramework · 📎 Agent Framework overview
The swarm's code is built on Microsoft Agent Framework, an open-source SDK for Python and .NET (Go is in preview). It brings together four areas.
Agents: an LLM plus tools and MCP servers, across many model providers. Every 🤖 in the architecture is an Agent Framework agent: the planner, reviewer, and report writer in the orchestrator, and the researcher inside each sandbox (with Foundry's hosted web search tool).
Workflows: a typed graph of executors (agents or plain functions) with explicit edges. The swarm is one workflow: the planner fans out to researcher branches, a collector fans in, and the reviewer either loops back to the planner or hands off to the report writer. The next slides show that code.
Harness agent: an opinionated agent for long, multi-step tasks, with planning, todo tracking, context compaction, file access, memory, and tool approval. The standalone sandbox agent (sandbox-agent/) is a harness agent with a shell tool.
Integrations: model providers, agent services, tools, context providers, middleware, evaluation services, and UI frameworks. Here: Foundry's hosted web search and the OpenTelemetry instrumentation that the trace slides use.
Building blocks underneath: model clients, agent sessions for state, context providers for memory, middleware, and MCP clients.
aka.ms/AgentFramework redirects to the GitHub repo (microsoft/agent-framework).
The swarm as a workflow graph
builder = WorkflowBuilder(start_executor=planner)
builder = builder.add_edge(planner, collector)
for r in researchers:
    builder = builder.add_edge(planner, r)
    builder = builder.add_edge(r, collector)
builder = builder.add_edge(collector, reviewer)
builder = builder.add_edge(reviewer, planner)
wf = builder.add_edge(reviewer, report_writer).build()
One edge per researcher, so the branches run concurrently.
📎 orchestrator/agents/workflow.py
🤖 planner researcher_0 📦 in a sandbox researcher_1 📦 in a sandbox researcher_2 📦 in a sandbox collector 🤖 reviewer 🤖 report_writer fan-out fan-in plan → approved gaps: one more wave
The whole swarm is one Agent Framework workflow: a typed graph of executors connected by edges. Some executors wrap agents (🤖 planner, reviewer, report_writer); the researchers are plain executors that each run one question in a sandbox.
Map each edge to the drawing. planner → each researcher is the fan-out; each researcher → collector is the fan-in. planner → collector carries a ResearchPlan so the collector knows how many answers to wait for. The reviewer has two outgoing edges: back to the planner when the evidence has gaps (at most one more wave), or on to the report writer when it's approved.
Why an edge per researcher instead of one fan-out edge group: Agent Framework's fan-out edge runner delivers its messages one after another, which would serialize the branches. Separate edges let them run concurrently.
The next two slides zoom into the planner's fan-out and a researcher branch.
Planner agent
🤖 planner researcher_0 📦 in a sandbox researcher_1 📦 in a sandbox researcher_2 📦 in a sandbox collector 🤖 reviewer 🤖 report_writer
class ResearchQuestions(BaseModel):
    questions: list[str] = Field(description="4-6 standalone research questions")

PLANNER_INSTRUCTIONS = (
    "Given a broad research topic, break it into 4-6 specific, "
    "focused sub-questions that together provide a comprehensive answer. "
    "Each question is sent by itself to an isolated researcher. "
    "Researchers cannot see the original topic, other questions, "
    "or other researchers' answers. Therefore every question MUST: "
    "- Be independently answerable with no prior findings... "
    "- Include the relevant subject, location, constraints... ")

planner = Agent(client=build_chat_client(), name="planner",
                instructions=PLANNER_INSTRUCTIONS)
Each researcher only sees its own question, so every question has to stand on its own.
📎 orchestrator/agents/planner_agent.py
The planner agent's prompt. The key constraint is isolation: each researcher only sees its own question, so the prompt makes every question self-contained (subject, location, constraints, decision criteria) and bans references like 'the shortlist' or 'the options' that point at another agent's answer. The output shape comes from the ResearchQuestions Pydantic model, not the prompt: with structured outputs, the model's response is constrained to that JSON schema, so the prompt doesn't need 'return only JSON' instructions and the code doesn't parse or strip code fences. The slide shows an abridged version of PLANNER_INSTRUCTIONS.
Fan-out planned questions to research nodes
🤖 planner researcher_0 📦 in a sandbox researcher_1 📦 in a sandbox researcher_2 📦 in a sandbox collector 🤖 reviewer 🤖 report_writer
# Ask the planner agent for questions, as structured output
result = await self.agent.run(payload.topic,
                              options={"response_format": ResearchQuestions})
questions = validate_questions(result.value)

# Tell the collector how many answers to expect
await ctx.send_message(
    ResearchPlan(expected_responses=len(questions), ...),
    target_id="research_collector")

# Send each question to its own researcher node
for i, question in enumerate(questions):
    await ctx.send_message(
        AgentExecutorRequest(messages=[Message("user", [question])]),
        target_id=f"researcher_{i}")
📎 orchestrator/agents/workflow.py
The planner executor runs the planner agent with response_format=ResearchQuestions, so result.value is a typed object instead of text to parse. validate_questions checks what a schema can't: 4 to MAX_RESEARCHERS (6) non-empty questions, a design choice to keep cost and model throttling in check.
ctx.send_message sends a typed message along one of the planner's edges. target_id picks which connected executor gets it, and the workflow runtime calls that executor's handler whose parameter type matches: ResearchPlan goes to the collector, AgentExecutorRequest to a researcher. Messages sent in one step are delivered together in the next, so all the researcher branches start at the same time.
First the collector learns how many answers to expect (the ResearchPlan), then each question goes to its own researcher_i.
On a follow-up wave the reviewer supplies the questions, so the planner skips its agent and dispatches them directly. Simplified from PlannerExecutor in workflow.py.
Send each question to a sandbox
🤖 planner researcher_0 📦 in a sandbox researcher_1 📦 in a sandbox researcher_2 📦 in a sandbox collector 🤖 reviewer 🤖 report_writer Each researcher node passes the question directly to a sandbox and returns either the response or an error.
class ResearcherExecutor(Executor):
    @handler
    async def run(self, request: AgentExecutorRequest,
                  ctx: WorkflowContext[AgentExecutorResponse]):
        question = request.messages[-1].text
        try:
            text = await self.run_in_sandbox(question)
        except Exception as ex:
            text = json.dumps({"question": question,
                               "error": str(ex), ...})
        await ctx.send_message(AgentExecutorResponse(...))
📎 orchestrator/agents/workflow.py
Each research question goes to a plain workflow executor, not an agent. It calls run_in_sandbox directly, so there's no LLM on the orchestrator side of a branch. If the sandbox fails, the executor still sends back an error finding, so the collector gets every answer and the reviewer sees what's missing.
An earlier version wrapped this in a dispatcher agent whose only job was to call run_in_sandbox once and echo the JSON back. That cost a model call per question and could garble the result, so the upstream sample (and now this repo) calls it directly.
Start sandbox with research agent and tools
🤖 planner researcher_0 📦 in a sandbox researcher_1 📦 in a sandbox researcher_2 📦 in a sandbox collector 🤖 reviewer 🤖 report_writer
async def run_in_sandbox(question: str) -> str:
    sandbox_id = f"agent-{index}-{uuid.uuid4().hex[:8]}"
    await sandbox_mgr.create_sandbox(sandbox_id, question)        # create
    try:
        while True:                                               # execute
            await asyncio.sleep(2)
            status = await sandbox_mgr.get_status(sandbox_id)
            if status.status == "done":
                result = await sandbox_mgr.get_result(sandbox_id) # collect
                break
    finally:
        await sandbox_mgr.delete_sandbox(sandbox_id)              # delete
    return json.dumps({"question": result.question,
                       "answer": result.answer, ...})
📎 sandbox_researcher.py
run_in_sandbox (orchestrator/agents/sandbox_researcher.py): create a sandbox from the research-agent disk image, poll until done, collect the result, and always delete the sandbox. Inside the sandbox, research-agent/app.py runs the researcher agent: Agent Framework with Foundry's hosted web search tool, reaching Foundry only through the egress rules and the proxy-injected token.
Real code tolerates transient poll errors (e.g., 502 while the port warms up) and times out after 360 s. Simplified from the source.
If you do want an agent to decide when to use a sandbox, make run_in_sandbox an agent tool. Sandboxes also ship an Agent Skill: in Copilot CLI, /plugin marketplace add microsoft/azure-container-apps, then /plugin install sandboxes@Azure-Container-Apps. Works with Claude Code or any skills folder.
Research agent inside the sandbox
🤖 planner researcher_0 📦 in a sandbox researcher_1 📦 in a sandbox researcher_2 📦 in a sandbox collector 🤖 reviewer 🤖 report_writer Runs in each sandbox with Foundry's hosted web search, and returns a structured finding.
class ResearchFinding(BaseModel):
    answer: str
    sources: list[str]
    confidence: float

agent = Agent(
    client=FoundryChatClient(project_client=project_client, model=model),
    name="ResearchAgent",
    instructions="Use web search to find current, factual information, "
                 "then synthesize a comprehensive answer that cites sources.",
    tools=[FoundryChatClient.get_web_search_tool()],
)
response = await agent.run(question, options={"response_format": ResearchFinding})
return response.value.model_dump()
📎 research-agent/app.py
This is the agent that actually does the research, in research-agent/app.py inside each sandbox. It's an Agent Framework agent with Foundry's hosted web search tool, so the search runs in Foundry and the sandbox never talks to a search engine. The project client gets a placeholder credential: the egress proxy replaces the Authorization header with a token for the sandbox group's managed identity. The proxy also inspects TLS, which is why the sample turns off certificate verification (a sample shortcut). With response_format=ResearchFinding, the Foundry Responses API constrains the answer to that schema even while the agent uses web search; response.value is the typed finding. The small Flask app around it reports status and the result, which run_in_sandbox polls for.
Collect answers for each wave
🤖 planner researcher_0 📦 in a sandbox researcher_1 📦 in a sandbox researcher_2 📦 in a sandbox collector 🤖 reviewer 🤖 report_writer A plain executor: waits for every planned answer, then sends one dossier to the reviewer.
class ResearchCollector(Executor):
    @handler
    async def set_plan(self, plan: ResearchPlan, ctx):
        self.plan = plan
        await self.release_if_ready(ctx)

    @handler
    async def collect_response(self, response: AgentExecutorResponse, ctx):
        self.responses.append(response)
        await self.release_if_ready(ctx)

    async def release_if_ready(self, ctx):
        if len(self.responses) >= self.plan.expected_responses:
            await ctx.send_message(ResearchDossier(findings=..., wave=...))
📎 orchestrator/agents/workflow.py
Two handlers, picked by message type: the ResearchPlan from the planner says how many answers to expect, and each AgentExecutorResponse from a researcher is one answer. The plan and the answers can arrive in either order. Once all the expected answers are in, it sends a single ResearchDossier to the reviewer, including findings from any earlier wave. The real code also holds answers that arrive before the next wave's plan. Simplified from ResearchCollector in workflow.py.
Reviewer agent: approve or research more
🤖 planner researcher_0 📦 in a sandbox researcher_1 📦 in a sandbox researcher_2 📦 in a sandbox collector 🤖 reviewer 🤖 report_writer
class ReviewDecision(BaseModel):
    status: Literal["approved", "needs_more_research"]
    rationale: str
    follow_up_questions: list[str]

result = await self.agent.run(dossier, options={"response_format": ReviewDecision})
decision = validate_review_decision(result.value)
if decision.status == "needs_more_research" and waves_remaining > 0:
    await ctx.send_message(FollowUpResearch(decision.follow_up_questions, ...),
                           target_id="planner")
else:
    await ctx.send_message(ApprovedDossier(...), target_id="report_writer")
📎 reviewer_agent.py · 📎 workflow.py
The reviewer agent reads the whole dossier and returns a ReviewDecision structured output: the Literal type means status can only be approved or needs_more_research. validate_review_decision checks the cross-field rules a schema can't express: 2 to 4 follow-up questions only when more research is needed, and none when approved. The agent decides, but the code enforces the limits: at most MAX_RESEARCH_WAVES (2), so after the second wave it always approves and notes the limitations. Follow-up questions go back to the planner, which dispatches them without calling its own agent; an approval goes on to the report writer. Prompt abridged from reviewer_agent.py.
Report writer agent
🤖 planner researcher_0 📦 in a sandbox researcher_1 📦 in a sandbox researcher_2 📦 in a sandbox collector 🤖 reviewer 🤖 report_writer
REPORT_WRITER_INSTRUCTIONS = (
    "Given the original topic, an evidence dossier from multiple research "
    "agents, and the reviewer's assessment, produce a single comprehensive "
    "markdown report. Include an executive summary, key findings organized "
    "by theme, material limitations, and a conclusion. Cite the supplied "
    "sources where available. Do not invent evidence or sources.")

prompt = format_dossier(dossier.topic, dossier.findings) + dossier.review_rationale
result = await self.agent.run(prompt)
await ctx.yield_output(result.text)  # the final report, streamed to the app
📎 report_writer_agent.py · 📎 workflow.py
The last agent turns the approved dossier and the reviewer's rationale into the final markdown report. yield_output is how a workflow returns results to its caller: the orchestrator receives it as an output event and sends the report to the web UI. The planner and reviewer also yield outputs (the questions and review decisions), which is how the UI shows each step.
Observability with OpenTelemetry (OTel)
OTel standardizes how apps emit traces, metrics, and logs, so debugging works the same across languages and vendors.
Traces
0s ───────────────────── 27s
sandbox.create
 └─ research-agent.run
     └─ invoke_agent ResearchAgent
Operations made of spans that show how a request moves through services: timing, dependencies, and context propagation.
Metrics
operation.duration  p95 26s
token.usage         24,968
requests            140/min
Numeric measurements such as latency, request counts, error rates, token usage, or any custom app metric.
Logs
INFO  Sandbox agent-2 running
INFO  Agent 3 completed research
WARN  get_status transient error
Structured log records with a message, severity, timestamp, and contextual attributes.
📎 OpenTelemetry signals
Parallel systems fail in parallel. When six sandboxes, a dozen model calls, and a review loop are all in flight, you need one place to see what happened.
OpenTelemetry is the vendor-neutral standard for that: your code emits traces, metrics, and logs once, and you can send them to Application Insights, Jaeger, Grafana, or any OTLP backend.
The examples are from this swarm: the trace shows a sandbox.create span with the in-sandbox research span under it; the metric names are Agent Framework's gen_ai.client.operation.duration and gen_ai.client.token.usage (shortened); the log lines are real orchestrator messages.
This talk focuses on traces, because they're what connect the orchestrator to each sandbox.
OpenTelemetry GenAI semantic conventions
Standard gen_ai.* span names and attributes for agent runs, model calls, and tool calls. A real span from this swarm:
Span: invoke_agent ResearchAgent (26.6 s)
Attribute Value
gen_ai.operation.name invoke_agent gen_ai.agent.name ResearchAgent gen_ai.request.model gpt-5.6-luna gen_ai.tool.definitions [{"type": "web_search"}] gen_ai.usage.input_tokens 22518 gen_ai.usage.output_tokens 2450
📎 github.com/open-telemetry/semantic-conventions-genai
The GenAI semantic conventions standardize what an agent span looks like, so any backend can show agent runs, model calls, and tool calls the same way, regardless of framework or provider.
This span came from Application Insights for a real run of this swarm: the research agent inside a sandbox, invoked on one question, took about 27 seconds and used 22.5K input and 2.4K output tokens. Its child spans include chat gpt-5.6-luna for each model call.
The span also carries gen_ai.system_instructions, gen_ai.input.messages, and gen_ai.output.messages, including the web search calls. Those contain prompts and answers, so they're only recorded when sensitive data is enabled (ENABLE_SENSITIVE_DATA, on in this sample).
Other operation names in the conventions: chat (a model call) and execute_tool (a local tool call).
Using OpenTelemetry with Agent Framework
Agent Framework has built-in support for emitting OpenTelemetry traces. Azure Monitor handles the export to Application Insights:
from azure.monitor.opentelemetry import configure_azure_monitor
from agent_framework.observability import enable_instrumentation

configure_azure_monitor(
    connection_string=os.environ["APPLICATIONINSIGHTS_CONNECTION_STRING"])
enable_instrumentation()
The same two calls run in the orchestrator and in every sandbox .
For sandboxes: pass the connection string in the sandbox environment, and allow the Application Insights endpoints in its egress policy.
📎 orchestrator/observability.py · 📎 research-agent/app.py
enable_instrumentation turns on Agent Framework's spans: workflow and executor spans, invoke_agent, chat, and execute_tool, plus the gen_ai metrics. configure_azure_monitor sets up the global tracer, meter, and logger providers, exports them to Application Insights, and auto-instruments outbound HTTP (requests, urllib3), so the Azure SDK and Foundry calls show up too.
The orchestrator also instruments FastAPI (FastAPIInstrumentor.instrument_app) and adds one custom span, sandbox.create, with the sandbox ID and region as attributes.
Inside the sandbox, the orchestrator passes APPLICATIONINSIGHTS_CONNECTION_STRING, OTEL_SERVICE_NAME=research-agent, and ENABLE_SENSITIVE_DATA as environment variables. The egress policy allows the ingestion endpoints parsed from the connection string. Because the egress proxy intercepts TLS, research-agent/app.py disables certificate verification for requests: a sample shortcut, don't copy it.
Next: how the sandbox's spans end up in the same trace as the orchestrator's.
Carry a trace across the sandbox boundary
Orchestrator: inject
def _traceparent_env() -> dict[str, str]:
    carrier: dict[str, str] = {}
    _otel_propagate.inject(carrier)
    env: dict[str, str] = {}
    if carrier.get("traceparent"):
        env["TRACEPARENT"] = carrier["traceparent"]
    if carrier.get("tracestate"):
        env["TRACESTATE"] = carrier["tracestate"]
    return env

environment.update(_traceparent_env())
📎 sandbox_manager.py
Sandbox: extract
from opentelemetry.propagate import extract

_PARENT_CTX = extract({
    "traceparent": os.environ.get("TRACEPARENT", ""),
    "tracestate": os.environ.get("TRACESTATE", ""),
})

tracer.start_as_current_span(
    "research-agent.run", context=_PARENT_CTX)
📎 research-agent/app.py
One trace: separate provisioning time from research/model time, find the slow or failed branch, and verify cleanup.
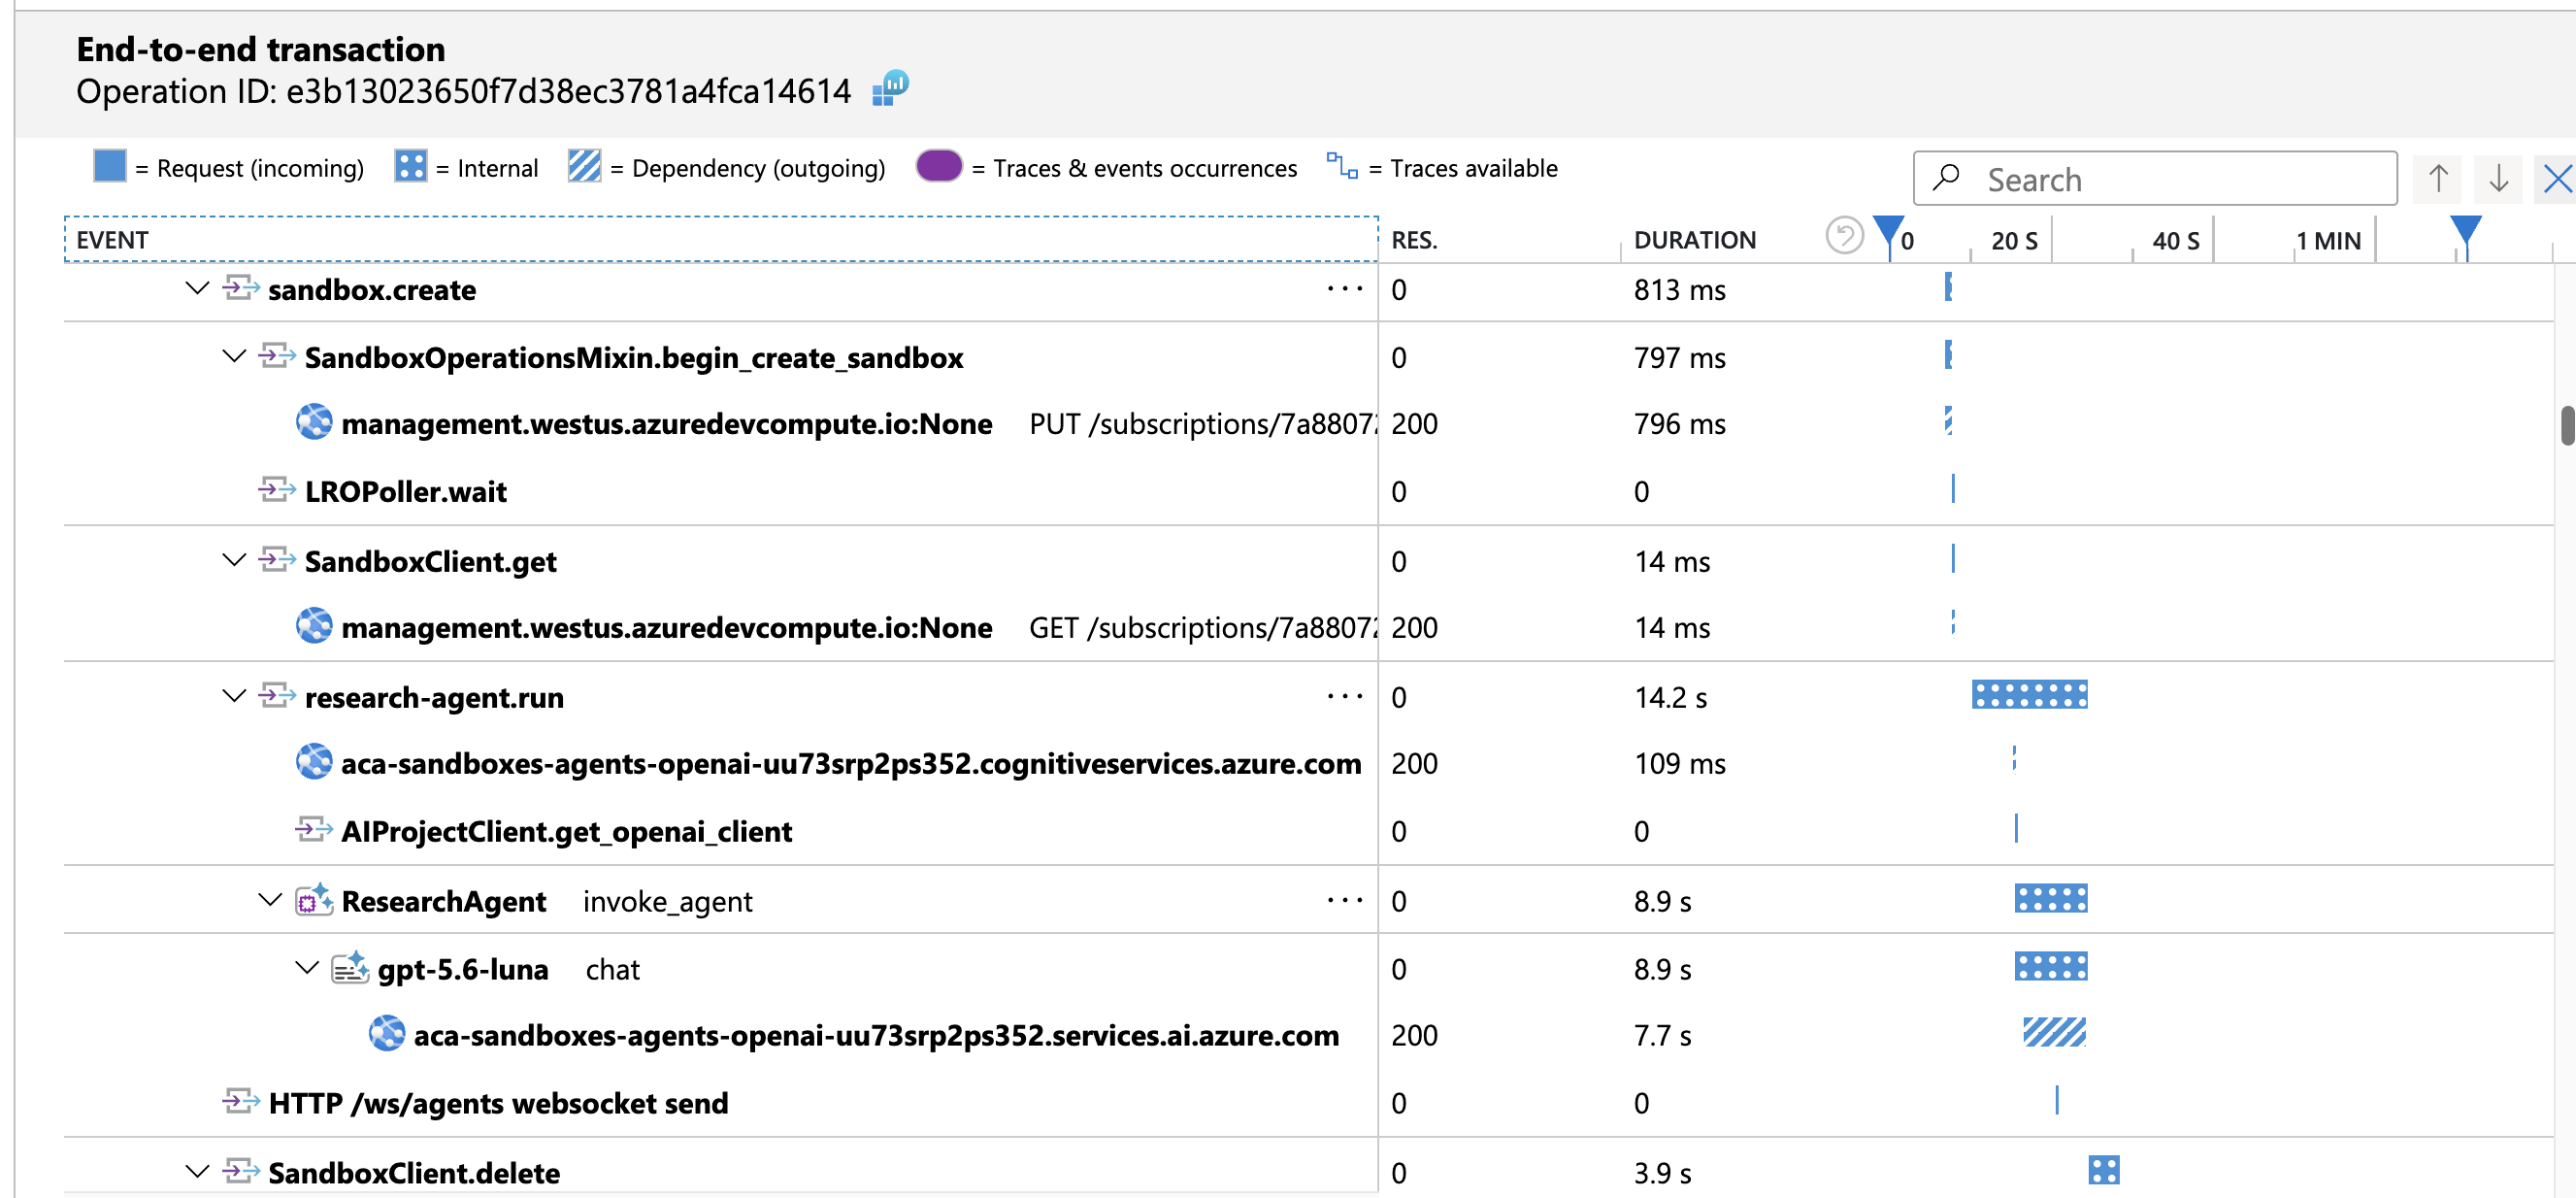
The sandbox.create span in the orchestrator becomes the parent of research-agent.run inside the sandbox.
Exporter config lives in orchestrator/observability.py for the editor walkthrough.
Platform option: a per-sandbox telemetryConfig, set at creation, exports stdout/stderr, OpenTelemetry signals, metrics, and NetworkEgressDecisions
to Log Analytics, Application Insights, or any OTLP backend, and injects OTEL_EXPORTER_OTLP_ENDPOINT. The sample doesn't use it.
Demo: follow the distributed trace
Screenshot: Application Insights, End-to-end transaction for one swarm run (operation e3b13023650f7d38ec3781a4fca14614), expanded on one research branch.
Read it top to bottom: sandbox.create is the orchestrator's custom span around begin_create_sandbox (about 800 ms including the PUT to the sandbox management endpoint). Then research-agent.run, which came from inside the sandbox: it's in the same trace only because the orchestrator passed TRACEPARENT in. Under it, the Agent Framework spans: ResearchAgent invoke_agent and gpt-5.6-luna chat, with the Foundry call through the egress proxy (7.7 s). Finally SandboxClient.delete cleans up.
Live: open Application Insights, Investigate, Transaction search, filter to the last hour, and open the orchestrator request for the run. Scroll to see the other sandbox.create spans overlapping in time (the fan-out).
Backup: this screenshot, if ingestion is delayed (it takes 2-3 minutes).
Part 4 of 4
Wrapping up
Introducing the swarm
Sandboxes 101
Back to the swarm
Wrapping up
The runtime problems we started with, where else sandboxes fit, and what to take away.
Takeaways
⚡
On-demand compute
Sub-second start, zero idle cost
Without: You pre-provision servers for the peak
With sandboxes: Sandboxes start in under a second and scale to zero
🛡️
Explicit boundaries
Isolation, egress, identity, data
Without: Agents can reach anything and hold API keys
With sandboxes: Egress rules, proxy-injected credentials, volumes
🔁
Explicit lifecycle
Create, stop, resume, delete
Without: Workspaces vanish on restart or keep burning budget
With sandboxes: Suspend, resume, snapshot, and auto-delete policies
📈
One trace
Across every sandbox
Without: Parallel failures are hard to find
With sandboxes: One distributed trace from planner to every sandbox
Four things to take away. On-demand compute: sandboxes start in under a second from prewarmed pools, so you create one per unit of work instead of provisioning for the peak, and stopped or deleted sandboxes cost nothing for compute. Explicit boundaries: decide what each sandbox can reach (egress and ingress), authenticate as (the group's managed identity, injected by the proxy), and keep (volumes, snapshots); each one runs in its own microVM. Explicit lifecycle: create, stop, resume, and delete are API calls, with policies as a backstop. One trace: propagate trace context into every sandbox so the whole run is one trace.
These answer the runtime problems from the start of the talk: untrusted code, cold starts, runaway budgets, workspaces that vanish on restart, and tooling stitched together by hand.
Scenarios for sandboxes
Use case What sandboxes provide
Agent workflows Persistent, isolated workspaces that survive across task boundaries AI code execution Safely run LLM-generated code in isolated environments with instant startup Platform building Build on the same primitive powering Microsoft services Burst workloads Scale from zero to thousands of sandboxes on demand Secure multi-tenant compute Strong isolation for untrusted workloads from multiple tenants Interactive user sessions Give each user their own isolated compute environment
Keep this under a minute. The swarm is one instance of the first two rows; the same lifecycle, egress, and identity patterns carry over.
Copilot Studio is a real-world agent-workflow example: one sandbox per agent with a data disk for memory.
Next: how sandboxes connect to events and other services.
Connecting sandboxes to your systems
📬 Event
New email or SharePoint upload
→
⚡ Trigger
Runs a command or calls a port
→
📦 Sandbox
Your agent does the work
→
🔌 Connector
Teams, SharePoint, Jira, GitHub, 100+ more
🔌 Connectors
Attach once to the sandbox group; each sandbox opts in when it's created.
MCP connectors give agents tools to discover. API connectors give app code REST endpoints.The group's identity authorizes calls, so there are no OAuth flows or tokens in the sandbox.
⚡ Triggers Preview
Watch a connector event, by polling on a schedule or by webhook.
Run a command in a sandbox, or POST to a port on a long-lived sandbox.
Authenticates with a managed identity, so there are no shared secrets.
📎 Connectors · 📎 Triggers
Transition from Scenarios for sandboxes: in every one of those use cases, and in our swarm, your code calls the Sandboxes API to start the work. But sandboxes can also start from events, like an email arriving or a file landing in SharePoint, and act on other services without holding any tokens. That's what turns sandboxes from background compute into something that can react and take actions.
Swarm idea: a trigger on a Teams channel could start a research run, and a Teams or SharePoint connector could post the final report back.
Connectors: a connector links the sandbox group to an external service (Office 365, SharePoint, Teams, Jira, Salesforce, GitHub, ServiceNow, and 100+ more), created in a connector namespace at connectors.azure.com. Attach it to the group (aca sandboxgroup connector add --connection-id ... --authorization system); each sandbox opts in at create time with --connection-id (up to 10, immutable after create). The group needs an identity attached. MCP connectors are for agents: with --disk copilot, the sandbox gets /root/.copilot/mcp-config.json automatically. API connectors are REST endpoints for app code.
Triggers (preview): az connector-namespace trigger create watches a connector event (for example SharePoint GetOnNewFileItems or Outlook OnNewEmail). Polling triggers take a recurrence; webhook and notification triggers push. The action calls the sandbox's executeShellCommand endpoint, or a port on a long-lived sandbox, authenticating with the connector namespace's managed identity.
Docs scenarios: email triage that posts important messages to a Teams channel (a fresh sandbox per email), invoice extraction when a PDF lands in SharePoint (one long-lived sandbox), an hourly SharePoint compliance audit, a daily email digest.
Not tried in this repo; from the docs as of September 29.
Choose the execution surface
ACA surface Best for Lifecycle
Apps Long-running services and APIs Continuous Jobs Scheduled or event-driven tasks Run to completion Dynamic sessions Managed code execution; the platform hides the infrastructure Pool-managed, ephemeral Sandboxes Programmable isolated compute that you control Stateful: create, stop, resume, snapshot, delete
The swarm uses an App for orchestration and Sandboxes for isolated research.
not need an ACA environment.
Source: 📎 Sandboxes overview
Rule of thumb from the docs: dynamic sessions for a managed experience that hides infrastructure; Sandboxes when you need
programmable control over images, networking, storage, and state. The docs have a longer comparison table for questions.
If asked why not Container Apps Express for the orchestrator: Express isn't compatible with azd yet. Express itself is built on Sandboxes.
Keep learning
You can start with one sandbox from the portal, CLI, or SDK, without deploying the swarm. The repo's create_sandbox.py is the quickest path, and azd up deploys the whole swarm.
 GitHub Copilot cloud sandboxes
 Microsoft Foundry hosted agents
 Azure Container Apps Express
 Azure SRE Agent
 Microsoft Copilot Studio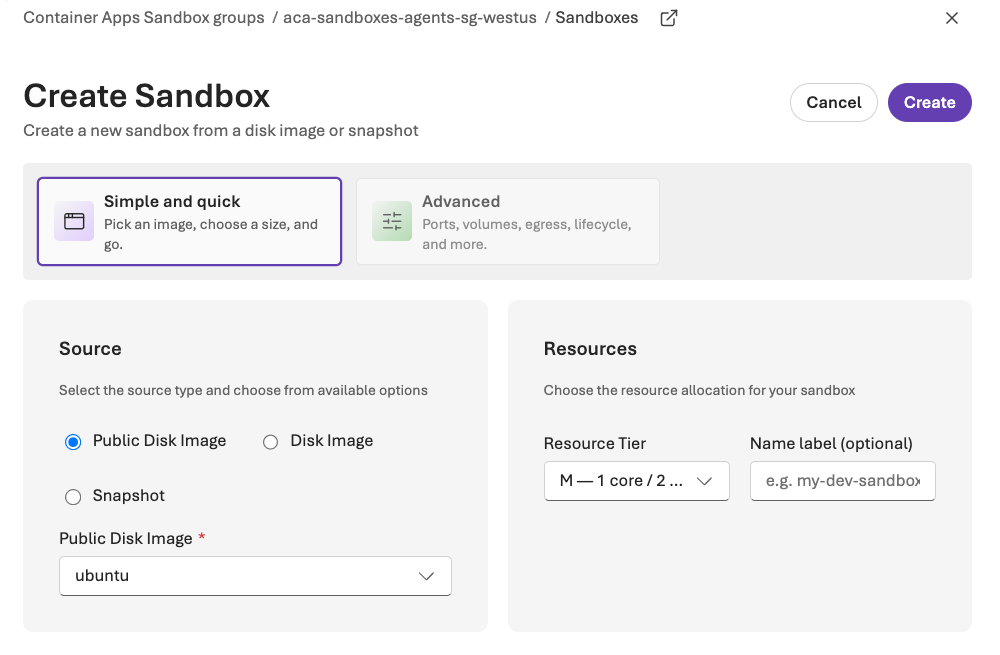


 Container Apps
 Container Registryresearch-agent image
 Microsoft Foundrymodels + web search
 Application Insightstelemetry